Most law firms assume profitability problems begin with client acquisition. More clients. More cases. More…

How Management Dashboard Are Transforming Law Firm Operations
Management dashboards, are revolutionizing how law firms operate by addressing the challenges of managing performance in real time. In the dynamic and fast-paced world of legal services, firms are under constant pressure to deliver exceptional client outcomes while juggling complex business operations. Without the ability to monitor performance effectively, many firms fall behind, leading to missed opportunities for growth, overlooked inefficiencies, and a reactive approach to managing financial health and client relationships.
What is the Management Dashboard?
The LawKPIs’ Management Dashboard provides law firm leadership with a top-level view of the firm’s financial health and operations. By consolidating metrics such as revenue, expenses, billable hours, and matter statuses into a single interface, this tool becomes indispensable for strategic planning and decision-making. Designed for Managing Partners, CFOs, and COOs, the dashboard ensures that leadership can monitor key performance indicators (KPIs) at a glance.
Key Metrics Monitored
-
Revenue: Total revenue earned monthly (MTD) and year-to-date (YTD), reflecting the firm’s income generation.
-
Expenses: Operational costs, including salaries, administrative expenses, and overhead, providing insight into spending patterns.
-
Net Income: Profit or loss, calculated by subtracting expenses from revenue, offering a clear picture of financial health.
-
Billable Activity Hours: Time worked that is eligible for client billing, a critical measure of productivity.
-
Non-Billable Amount: Time spent on administrative or other non-revenue-generating activities, helping to identify inefficiencies.
-
Work In Progress (WIP): Unbilled but ongoing work, representing potential future revenue.
-
Collections: Total amount collected from clients during a period, indicating cash flow health.
-
Open and Closed Matters: Data that highlights the efficiency of case management pipelines.
-
AR Aging Summary: Outstanding accounts receivable categorized by age, essential for managing overdue payments.
How Leadership Uses the Management Dashboard
Managing Partners
Managing Partners rely on the dashboard to assess overall firm profitability and evaluate operational efficiency. They use the data to identify high-performing practice areas, evaluate staffing needs, and strategize long-term goals.
CFOs
For Chief Financial Officers, the dashboard is a go-to resource for monitoring financial health. It helps track revenue trends, identify cost overruns, and address collection issues through the AR aging summary.
COOs
Chief Operating Officers utilize the dashboard for operational insights. Metrics like billable vs. non-billable hours and the balance of open vs. closed matters allow them to manage resources effectively and streamline workflows.
Practical Applications of the Dashboard
Profitability Analysis
Reviewing revenue and net income figures helps firm leadership understand profitability at a glance. Comparing MTD and YTD metrics ensures the firm stays on track to meet financial targets.
Cash Flow Monitoring
Tracking total collections and using the AR aging summary help maintain liquidity. Overdue payments can be identified and addressed proactively to ensure smooth cash flow.
Work Efficiency Assessment
Examining billable activity hours versus non-billable amounts reveals how effectively the firm’s time is being utilized. High non-billable hours can signal inefficiencies that negatively impact profitability.
Matter Tracking
Metrics on open and closed matters provide valuable insights into case management efficiency. A healthy balance between the two ensures cases progress efficiently through the pipeline.
Strategic Reviews
Monthly, quarterly, and end-of-year reviews are enhanced by the dashboard’s comprehensive data. Leaders can make informed decisions about budgeting, resource allocation, and future planning.
When to Use the Management Dashboard
-
Monthly/Quarterly Financial Reviews: Leadership can assess financial performance, make adjustments to resource allocation, and identify trends for strategic decisions.
-
End-of-Year Planning: YTD metrics provide a comprehensive view of the firm’s yearly performance, aiding in year-end reporting and goal-setting for the upcoming year.
-
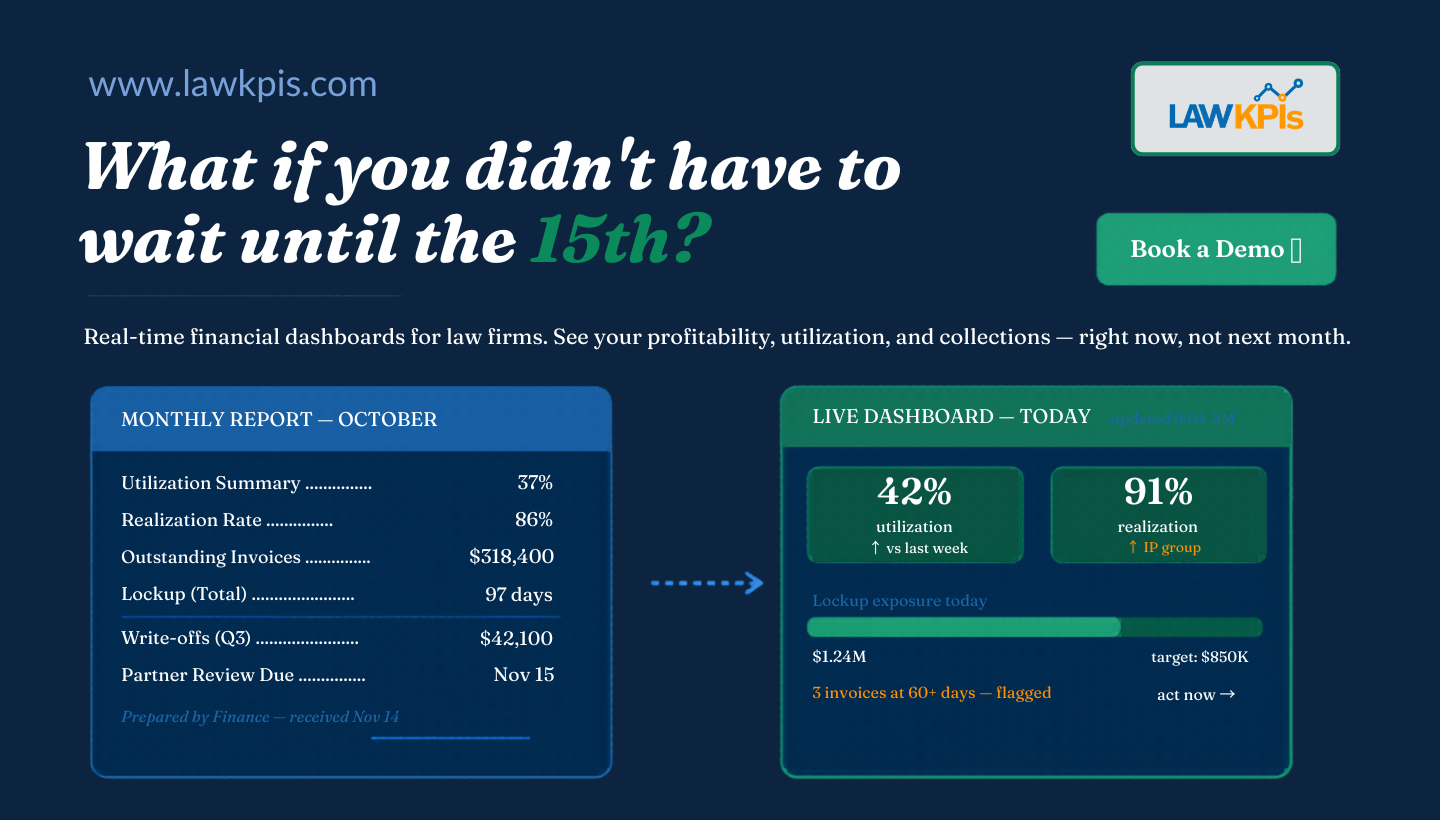
Real-Time Decision-Making: With live data, leaders can quickly identify and address issues, ensuring the firm stays agile and responsive.
Visualize the Impact of the Dashboard
Imagine having a real-time view of your firm’s revenue, expenses, and profit at your fingertips. How would access to your financial health at a glance change your strategic planning? If inefficiencies in non-billable hours could be spotted and addressed quickly, how much additional revenue could your firm generate each month?
The Management Dashboard empowers law firm leaders to answer these questions with actionable insights. By centralizing and simplifying complex data, it enables firms to focus on growth, efficiency, and exceptional client service.
Why Every Law Firm Needs the Management Dashboard
The Management Dashboard is more than just a reporting tool—it is a vital asset for law firms striving to stay competitive in today’s market. By offering a comprehensive overview of financial health and operational performance, it enables leadership to identify trends, allocate resources effectively, and plan for sustainable growth. Real-time insights into metrics like collections, productivity, and profitability ensure firms can make informed, data-driven decisions.
LawKPIs: Simplifying Decision-Making with Advanced Dashboards
LawKPIs has introduced 10 new easy-to-use dashboards, including the Management Dashboard, designed to meet the unique needs of law firms. These dashboards seamlessly integrate with Clio to provide actionable insights, empowering firms to enhance decision-making and achieve their business goals.
Discover how LawKPIs dashboards can transform your firm’s performance. Download the guide to the Top 10 Dashboards Every Law Firm Must Have at https://product.lawkpis.com/lawkpis-top-10-dashboards-guide Take control of your firm’s future today!

Related Posts